In the last post, we talked about why it is very difficult to predict currency prices or for that matter stock prices using machine learning algorithms. Artificial intelligence and machine learning are new games that are being played by quants. But when it comes to mathematically predicting market prices everything falls haywire. Now take a look at the following EURUSD chart.
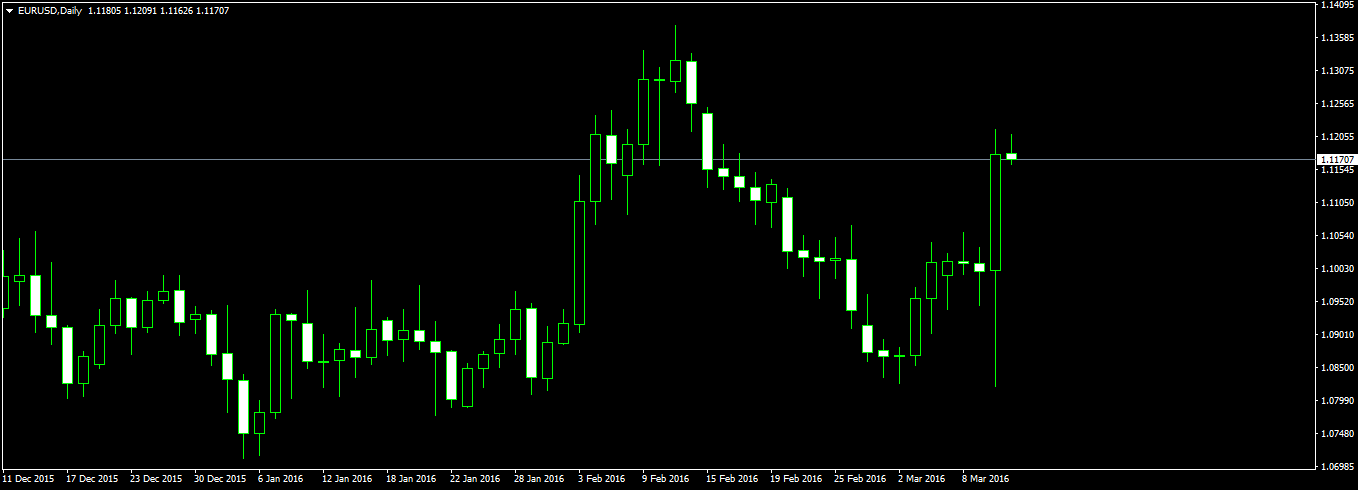
Now you can see a big candle on the daily chart that is approximately 400 pips in range. This big daily candle was formed yesterday when ECB President Mario Draghi gave a bazooka to the market in the form of rate cut and announcement of big QE. As expected, the ECB lowered its deposit rate further into negative territory to -0.4 percent. It lowered its main refinancing rate by five basis points to zero, a move that took some economists by surprise. The Governing Council also added an additional 20 billion euros to its asset purchase program and announced a new series of longer-term refinancing operation (TLTRO II) to be launched starting in June.
ECB controls EURO. A long time back, EURUSD had topped at 1.49380. It was in May 2011. Then it made some gains. In 2014 March, it again found heavy resistance 1.39937 and since then it has been falling steadily. Now it is showing a double bottom pattern on the monthly chart. We believe the present ECB stimulus package has started an EURUSD uptrend. Now let’s return to the ECB Press Conference and EURUSD craziness during that press conference. Take a look at the EURUSD H4 chart below.
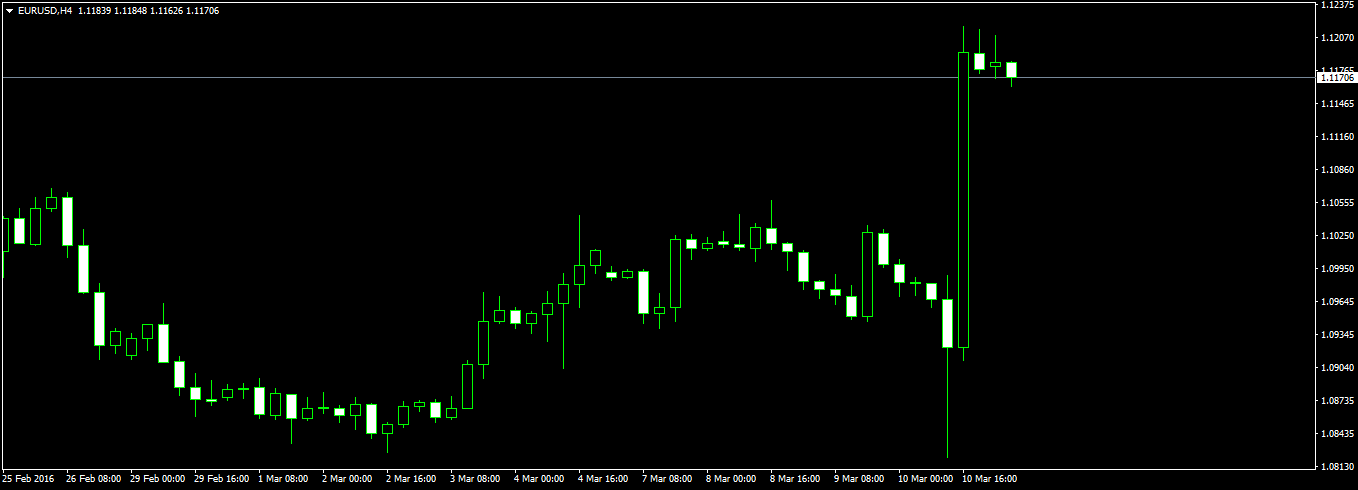
In the above chart you can see EURUSD first fell heavily around 200 pips then market suddenly changed direction and moved up 400 pips. Now the best charts to trade the news are the H1, M30 and M15. Take a look at the H1 chart below.
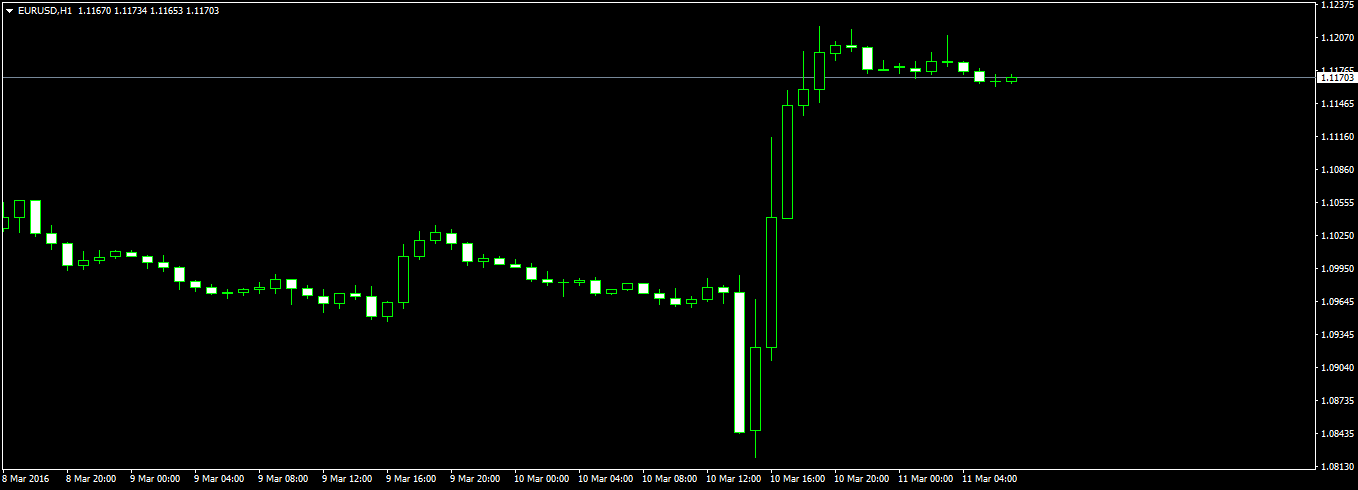
In the above chart you can see first a down move of around 200 pips as said above. Then a bullish candle appears and there is an up move of 400 pips. If you are not an experienced trader, you should not try to trade these ECB Press Conferences. Stay away from the markets during the time of ECB Press Conference. ECB press conference bring volatility in the markets and no matter what pair you are trading, you will feel that volatility. Take a look at the M30 chart below.
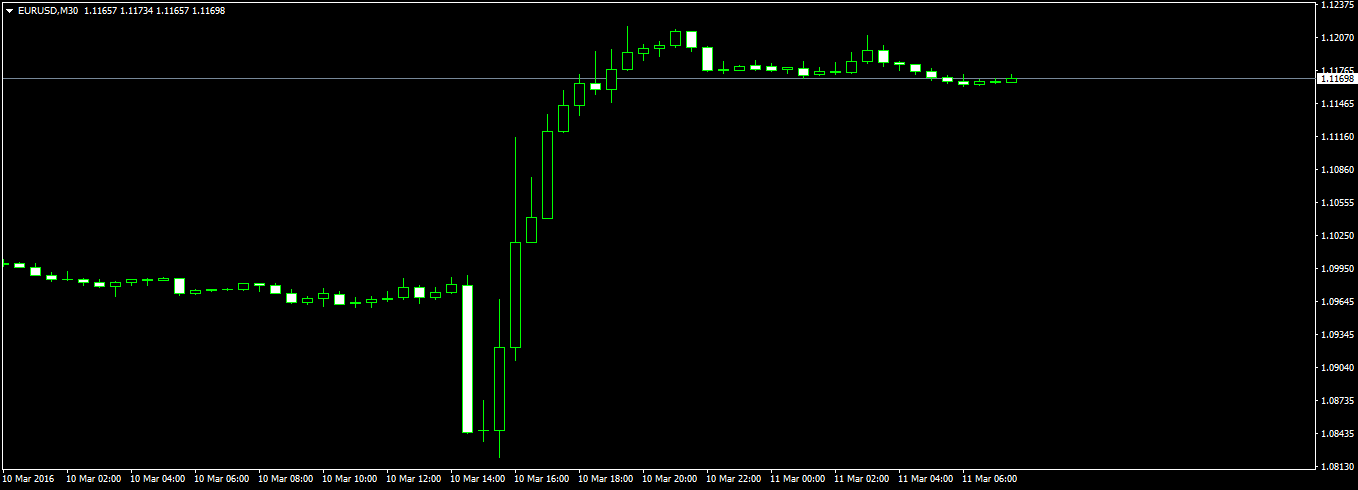
In the chart above you can see big candles are being formed. M15 is the best timeframe when it comes to trading the news. Now take a look at EURUSD M15 chart below!
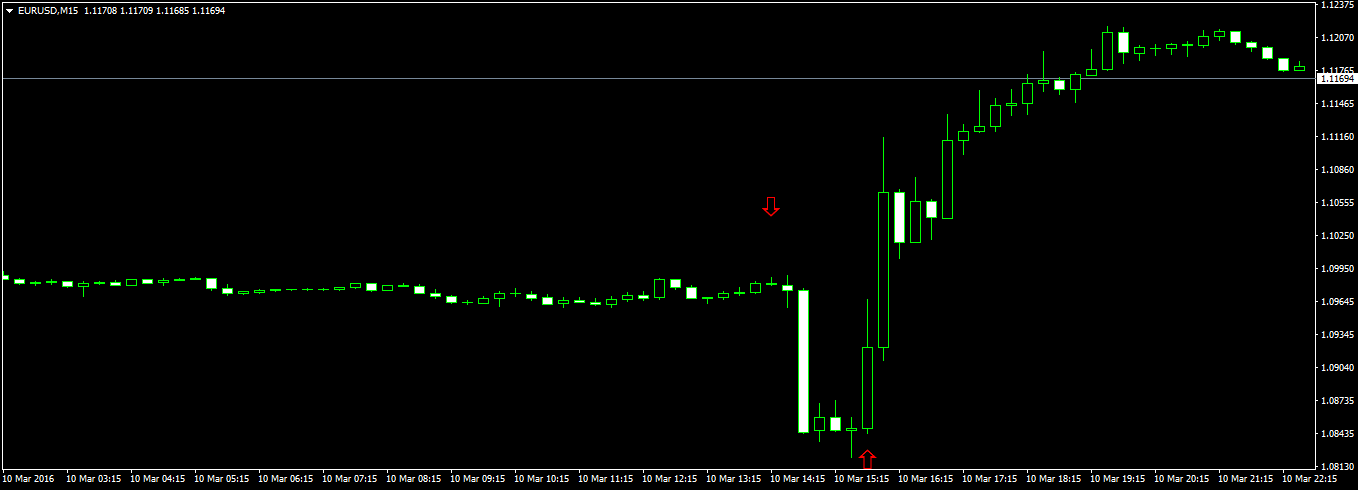
In the above chart, we have marked the entry for the short trade with a red down arrow and close for the short trade and opening of a long trade with a red up arrow. Can you see the bullish pin bar just above the red up arrow in the above screenshot. The risk is only 30 pips> Entry was at 1.08484 and the stop loss at 1.08184. You could have closed the trade at 1.12149 making a whopping 360 pips in just 8 hours. Always keep this in mind trading is all about taking risk. When you have a low risk entry and you think the reward can be huge you should take it. In the present case, this is what you should have done. Make the entry with the stop loss of 30 pips and take profit target of 240 pips. This would have given you a reward to risk ratio of 8:1. After that you should have closed the computer and checked the next day. Only 2 possibilities. Either the stop loss will get hit or the take profit target will get hit. So this is what trading is all about. Taking risk.
When you have a low risk entry go for it. Just make sure you don’t risk more than 2% on the trade which means if you have $10K in your account, open the trade with 1 standard lot which means risking $300. You made $2400. EURUSD is bullish now and it might end the month with a big gain.