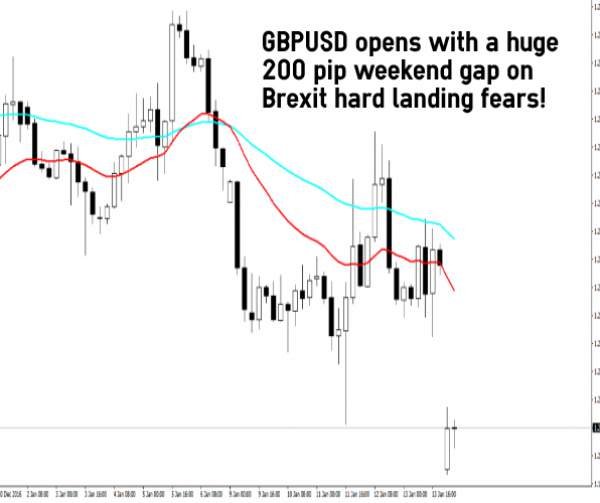
For the last many weeks, GBPUSD has been under a lot of pressure due to Brexit. Analysts are of the opinion that GBPUSD will be in a downtrend for a long time. Did you read the post on how to trade with pivot points? Over the weekend, Theresa May UK Prime Minister again hinted at a hard Brexit. This statement during the weekend forced GBPUSD to open with a huge 200 pips weekend gap. Take a look at the following screenshot.
Now if you trade GBPUSD you should know that over the next many weeks, GBPUSD will be showing a lot of weekend gaps as the hard Brexit fears play out. When you are trading GBPUSD you have to keep eye on 2 economies. One is the British economy. The other is the US economy. Both are showing volatility right now. Britain voted for Brexit. There are rumors of Brexit hard landing which makes British Pound nervous. So whenever the British PM talks about a hard Brexit, you will see British Pound GBP showing nervous. The only way to go right now is down. On the other hand, President Donald Trump is also making markets nervous whenever he speaks. Last week, he spoke and US Dollar went down. So you have to take these two effects into account when you are trading. Did you read the post on how the Federal Reserve Bank could trigger the next global financial crisis? So keep an eye on both the British as well as the US economies when you are trading GBPUSD pair. Markets are fickle always remember this. A statement made during the weekend can make this pair highly nervous when it opens on Monday. So it is always a good idea to close the trade in the last hours of Friday and reopen it next week on Monday.
Now a days quantitative trading is becoming very popular. Traders are combining technical analysis with quantitative analysis. Both augment each other. Quantitative analysis makes a prediction. You check that prediction using technical analysis and find both are confirming each other. This makes your trading more accurate and solid. On the other hand, quantitative analysis and technical analysis give contradictory predictions. You stay away from the market. Did you take a look at our Time Series Analysis for Traders Course? In this Time Series Analysis For Traders, we show you how you can use quantitative time series analysis in predicting market direction and using in your trading. We also have developed another course on Python Machine Learning For Traders. In this course we teach how to use machine learning in your trading.
When you analyze a currency pair always start from the weekly chart. This is the main chart that shows you the main trend. Once you have taken a look at the weekly chart, you should analyze the daily chart. Daily chart will give you the idea for the trade. After that you switch to H4 chart and look for low risk entries. Risk management is the most important thing in trading. Always make sure you enter the market with the lowest risk. Did you read the post on how to make 600 pips in 2 days with a small 10 pip stop loss? In this post I explain how you are going to analyze the charts and look for a low risk entry. Now when you are trading, it is very difficult to predict how much the market is going to move. So ride the trend as long as you can. This is what professional traders do. Your risk is small. Once you have the correct direction, move the stop loss to breakeven and then just ride the trend as long as you can.