Camarilla Pivot Points are frequently used by professional traders in their trading. If you don’t know how to trade with pivot points, you can watch these video tutorials that explain how to trade with pivot points. Pivot point is simply the average of the High, Low and Close of the last period. If you are using daily timeframe, daily pivot point is the average of the daily high, daily low and the daily close of the previous day. All these are known so you can easily calculate this level for today.
How To Calculate The Camarilla Pivot Points?
Professional traders also calculate a number of resistance and support levels based on this pivot point formula. These Support and Resistance S/R levels are based on previous days high, low and close. These are then used in today’s trading. There are different formulas to calculate these S/R levels. Three most used formulas are the standard pivot point formula, the Camarilla pivot point formula and the Fibonacci Pivot Point Formula. In this post we calculate the Camarilla Pivot Point S/R levels. You should watch these video tutorials that explain how to trade with the Camarilla Pivot Points. The following infographic gives you the formula that is used to calculate the 4 Resistance and 4 Support levels. Since the formula uses previous day’s high, low and close, all these levels are known at the start of the day. This makes Camarilla Pivot Points a leading formula. We observe price action reaction at these levels and then we make our trading decisions.
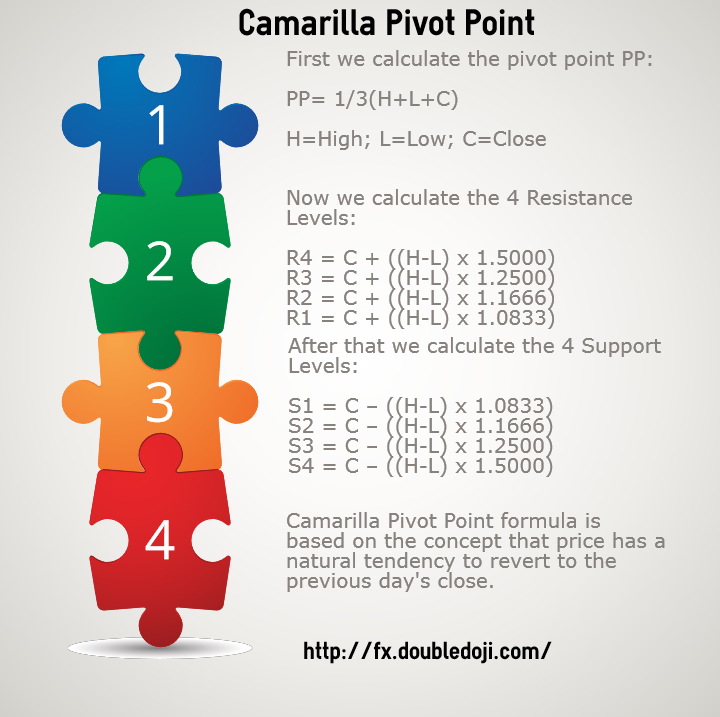
Did you observe one thing in the above Camarilla Pivot Points Formula? The 4 Support and Resistance levels don’t depend on the Pivot Point PP at all. The 4 Support and Resistance levels rather depend on the previous close and the previous range( difference of previous high and previous low). This is something important for you know. What this means is these support and resistance levels can be all above or below the pivot point which might surprise you sometimes. But if you know how the formula is calculated you wont get surprised.
Download Camarilla Pivot Point MT4 Indicator
You can download the Camarilla Pivot Point MT4 indicator below. Just copy the MQL4 code below and paste it in a notepad file. Save this text file as camarillapivots.mq4. Now open the MetaEditor of MT4 and open this camarillapivots.mq4 file in it. Compile this file. This will automatically generate the camarillapivots.exe file. Now click on File and then click on Open Data Folder. Double click on MQL4 folder and drag these 2 files into Indicators folder. You are now all set to trade with this indicator.
//+——————————————————————+
//| CamarillaPivot.mq4 |
//| Hassam |
//| http://tradingninja.com |
//+——————————————————————+
#property copyright “Hassam”
#property link “http://tradingninja.com”
#property version “1.00”
#property indicator_chart_window
//#property indicator_separate_window
#property indicator_buffers 9
#property indicator_color1 Orange
#property indicator_color2 DarkBlue
#property indicator_color3 DarkBlue
#property indicator_color4 Maroon
#property indicator_color5 Maroon
#property indicator_color6 Green
#property indicator_color7 Green
#property indicator_color6 Yellow
#property indicator_color7 Yellow
//—- input parameters
//—- buffers
double PBuffer[];
double S1Buffer[];
double R1Buffer[];
double S2Buffer[];
double R2Buffer[];
double S3Buffer[];
double R3Buffer[];
double S4Buffer[];
double R4Buffer[];
string Pivot=”Pivot Point”,Sup1=”S 1″, Res1=”R 1″;
string Sup2=”S 2″, Res2=”R 2″, Sup3=”S 3″, Res3=”R 3″, Sup4=”S 4″, Res4=”R 4″;
int fontsize=10;
double P,S1,R1,S2,R2,S3,R3,S4,R4;
double LastHigh,LastLow,x;
//+——————————————————————+
//| Custor indicator deinitialization function |
//+——————————————————————+
int deinit()
{
//—- TODO: add your code here
ObjectDelete(“Pivot”);
ObjectDelete(“Sup1”);
ObjectDelete(“Res1”);
ObjectDelete(“Sup2”);
ObjectDelete(“Res2”);
ObjectDelete(“Sup3”);
ObjectDelete(“Res3”);
ObjectDelete(“Sup4”);
ObjectDelete(“Res4″);
//—-
return(0);
}
//+——————————————————————+
//| Custom indicator initialization function |
//+——————————————————————+
int init()
{
string short_name;
//—- indicator line
SetIndexStyle(0,DRAW_LINE,0,2,Orange);
SetIndexStyle(1,DRAW_LINE,0,2,DarkBlue);
SetIndexStyle(2,DRAW_LINE,0,2,DarkBlue);
SetIndexStyle(3,DRAW_LINE,0,2,Maroon);
SetIndexStyle(4,DRAW_LINE,0,2,Maroon);
SetIndexStyle(5,DRAW_LINE,0,2,Green);
SetIndexStyle(6,DRAW_LINE,0,2,Green);
SetIndexStyle(7,DRAW_LINE,0,2,Yellow);
SetIndexStyle(8,DRAW_LINE,0,2,Yellow);
SetIndexBuffer(0,PBuffer);
SetIndexBuffer(1,S1Buffer);
SetIndexBuffer(2,R1Buffer);
SetIndexBuffer(3,S2Buffer);
SetIndexBuffer(4,R2Buffer);
SetIndexBuffer(5,S3Buffer);
SetIndexBuffer(6,R3Buffer);
SetIndexBuffer(7,S4Buffer);
SetIndexBuffer(8,R4Buffer);
//—- name for DataWindow and indicator subwindow label
short_name=”Camarilla Pivot Point”;
IndicatorShortName(short_name);
SetIndexLabel(0,short_name);
//—-
SetIndexDrawBegin(0,1);
//—-
//—-
return(0);
}
//+——————————————————————+
//| Custom indicator iteration function |
//+——————————————————————+
int start()
{
int counted_bars=IndicatorCounted();
int limit, i;
//—- indicator calculation
if (counted_bars==0)
{
x=Period();
if (x>240) return(-1);
ObjectCreate(“Pivot”, OBJ_TEXT, 0, 0,0);
ObjectSetText(“Pivot”, ” Pivot Point”,fontsize,”Arial”,Red);
ObjectCreate(“Sup1”, OBJ_TEXT, 0, 0, 0);
ObjectSetText(“Sup1″, ” S 1″,fontsize,”Arial”,Red);
ObjectCreate(“Res1”, OBJ_TEXT, 0, 0, 0);
ObjectSetText(“Res1″, ” R 1″,fontsize,”Arial”,Red);
ObjectCreate(“Sup2”, OBJ_TEXT, 0, 0, 0);
ObjectSetText(“Sup2″, ” S 2″,fontsize,”Arial”,Red);
ObjectCreate(“Res2”, OBJ_TEXT, 0, 0, 0);
ObjectSetText(“Res2″, ” R 2″,fontsize,”Arial”,Red);
ObjectCreate(“Sup3”, OBJ_TEXT, 0, 0, 0);
ObjectSetText(“Sup3″, ” S 3″,fontsize,”Arial”,Red);
ObjectCreate(“Res3”, OBJ_TEXT, 0, 0, 0);
ObjectSetText(“Res3″, ” R 3″,fontsize,”Arial”,Red);
ObjectCreate(“Sup4”, OBJ_TEXT, 0, 0, 0);
ObjectSetText(“Sup4″, ” S 4″,fontsize,”Arial”,Red);
ObjectCreate(“Res4”, OBJ_TEXT, 0, 0, 0);
ObjectSetText(“Res4″, ” R 4″,fontsize,”Arial”,Red);
}
if(counted_bars<0) return(-1);
//—- last counted bar will be recounted
// if(counted_bars>0) counted_bars–;
limit=(Bars-counted_bars)-1;
for (i=limit; i>=0;i–)
{
if (High[i+1]>LastHigh) LastHigh=High[i+1];
if (Low[i+1]<LastLow) LastLow=Low[i+1];
double Range=LastHigh-LastLow;
if (TimeDay(Time[i])!=TimeDay(Time[i+1]))
{
P=(LastHigh+LastLow+Close[i+1])/3;
R1 = Close[i+1] + Range*1.1/12;
S1 = Close[i+1] – Range*1.1/12;
R2 = Close[i+1] + Range*1.1/6;
S2 = Close[i+1] – Range*1.1/6;
R3 = Close[i+1] + Range*1.1/4;
S3 = Close[i+1] – Range*1.1/4;
R4 = Close[i+1] + Range*1.1/2;
S4 = Close[i+1] – Range*1.1/2;
LastLow=Open[i]; LastHigh=Open[i];
ObjectMove(“Pivot”, 0, Time[i],P);
ObjectMove(“Sup1”, 0, Time[i],S1);
ObjectMove(“Res1”, 0, Time[i],R1);
ObjectMove(“Sup2”, 0, Time[i],S2);
ObjectMove(“Res2”, 0, Time[i],R2);
ObjectMove(“Sup3”, 0, Time[i],S3);
ObjectMove(“Res3”, 0, Time[i],R3);
ObjectMove(“Sup4”, 0, Time[i],S4);
ObjectMove(“Res4”, 0, Time[i],R4);
}
PBuffer[i]=P;
S1Buffer[i]=S1;
R1Buffer[i]=R1;
S2Buffer[i]=S2;
R2Buffer[i]=R2;
S3Buffer[i]=S3;
R3Buffer[i]=R3;
S4Buffer[i]=S4;
R4Buffer[i]=R4;
}
//—-
return(0);
}
//+——————————————————————+
Now below is a screenshot of this indicator.
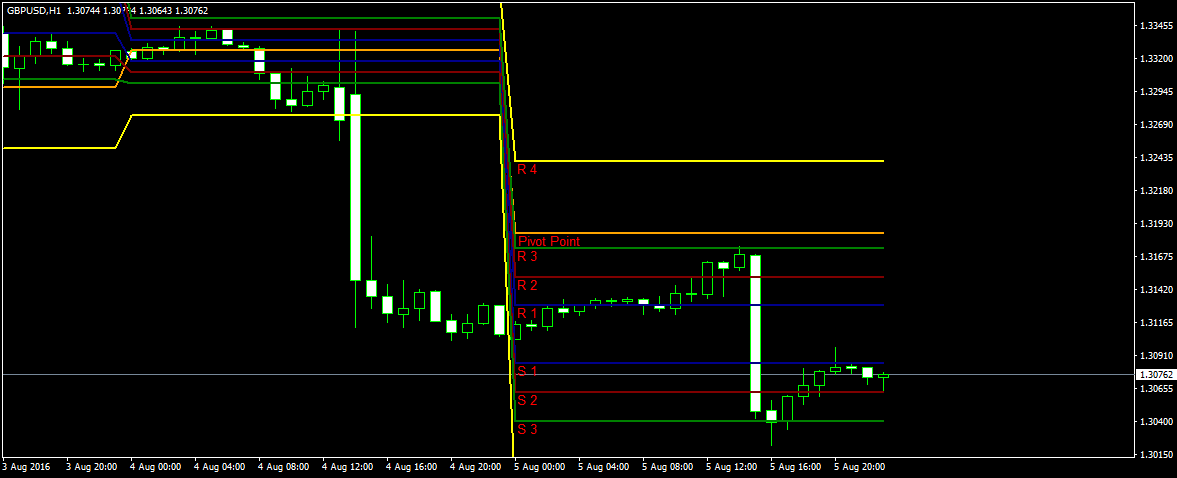
Above is a screenshot of this Friday which was NFP Report release day. Do you see price finding resistance at RYou can R3 level on GBPUSD H1 timeframe. Let’s see this same thing on GBPUSD M30 timeframe.
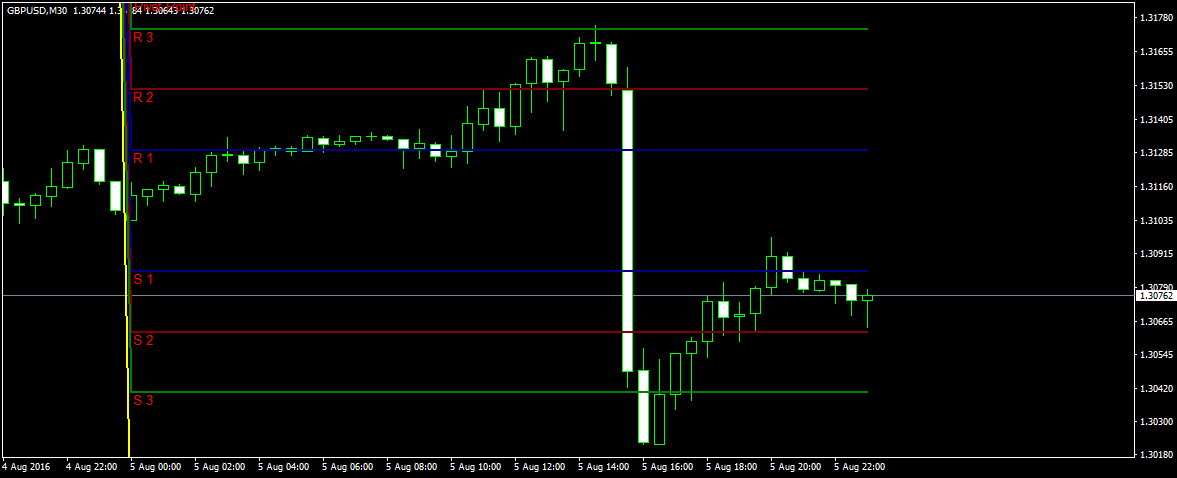
On GBUSDM30 chart, you can see a doji forming just at R3 Camarilla Resistance Level. You could have made an entry with a small stop loss of 10 pips and set the profit target to be at S3 which is 1.3041. In the next 1 hour and 30 minute this profit target was hit and you would have easily made 100+ pips.
Camarilla Pivot Point Strategy
In the post how to trade with Camarilla Pivot Points, I have posted a few videos that explains a few simple strategies that you can use when trading with these levels. The strategy is simple. If price action closes below R3 or above S3, it means a retracement to previous day’s close. You can always chose R3 and S3 as your profit target. On the other hand if price closes above R4 or below S4, it means a breakout and you should open a buy trade if price closes above R4 or a sell trade if price closes below S4. It is always a good idea to combine these pivot points with candlestick breakout patterns. For example in the above screenshot we used the doji pattern formed on M30 to judge that price is going to fall down. This was just 30 minutes before the NFP Report release. The risk was only 10 pips and we made an easy 100 pips which gives an excellent reward to risk of 10:1. Keep your trading simple and you will see you start making one winning trade after another.