In this post, I will develop the currency strength in Python. The problem that you will face as a currency trader on daily basis is which currency pair to trade. You look at EURUSD and find a nice trade setup and immediately open a trade. But at the end of the day EURUSD has only moved 30 pips whereas when you look at USDJPY it moved 100 pips. You wonder why didn’t you open a USDJPY trade instead of EURUSD. How to solve this practical problem of which currency pair to choose for trading and which currency pair to ignore for trading even if you have a good trade setup on that pair. In this post we will discuss how to solve this problem using currency strength. Read the post on how to connect MT4 with Python using ZeroMQ.
So we need a method that can shortlist the currency pair that is about to make a big move. We also need a method that helps us avoid currency pairs that are ranging and not going to move alot during the next 24-48 hours. The number one reason why most swing traders lose is when they enter into a trade hoping the currency pair is about to move big time but it moves only a little. Make a number of such trades and your account will start showing a sizable drawdown. On the other hand make a trade that make you 100-200 pips and your account will start showing good profit. Currency Strength is one such method that has been used successfully to shortlist currency pairs about to move big time. Read the post on how to develop indicators for EAs.
You must have used many indicators in your trading strategies. Indicators like Stochastics, MACD, RSI, CCI and of course we all use Moving Averages a lot. You must be knowing Relative Strength Index (RSI) indicator very well. If not then in this post I will make an attempt to introduce you to the intricacies of RSI. It is a powerful indicator rather an oscillator. What is an oscillator? An oscillator oscillates between two extreme values. In RSI case it is 0 and 100. When RSI goes above 70, we say the market is overbought and when the RSI goes below 30, we say the market is oversold. Read the post on trend following algorithmic trading system in python.
Overbought and oversold concepts are used a lot but have a broad meaning. A market can stay overbought/oversold for a pretty long time especially if it is trending strongly. Most of the time you will find trading strategies that will tell you to buy when RSI is below 30 and sell when the market is above 70. When the RSI is below 30, we say the currency pair is weak and when the RSI is above 70, we say the currency pair is strong. So basically RSI is oscillating between strength and weakness. Learn how to predict prices using Kernel Ridge Regression.
An indicator is basically a price transformation which is used to transform price into something that gives a better picture of the market. All indicators are calculated from price. Keep this in mind. Price is what is important. Indicators just transform the price in a way to make us view a pattern in the market. Also keep this in mind. Indicator don’t work most of the time as they give false signals. As a quant it is our job to filter out the false signals. Filtering false signals is like finding the needle in the haystack. Learn about Interdealer Brokers.
Our main aim is to catch the big moves or what we call trends in the market. But we also know that markets trend not that much. What we will do is trade the 28 currency pairs with the hope that we will catch the trend on a few of them. With this objective in mind, we will be using the concept of currency strength to shortlist the pairs that have the highest potential of trending. This is what we are looking a 100-200 pips move. We are not looking for 500-1000 pip moves just 100-200 pips move that happen very regularly in the currency market on a weekly basis. Can currency strength help us in finding the pairs that will move 100-200 pips in the coming days? We will see in this post. Download Camarilla Pivot Point indicator.
The main problem in trend trading is whipsaw trades. This mostly happens when we are not very clear whether the market is ranging or trending. Whatever, we will use Relative Strength Indicator (RSI) to measure the strength of each currency. You will ask how? RSI when it is above 70 on a currency pair means the currency pair is overbought and when it is below 30 we says the currency pair is oversold. We talked about it before also. Now when we want to measure the strength of USD we will look at all the USD pairs: EURUSD, GBPUSD, USDCHF, USDJPY, NZDUSD, AUDUSD and USDCAD. We will take RSI reading for EURUSD , GBPUSD, USDCHF, USDJPY, NZDUSD, AUDUSD and USDCAD pairs. If USD is the base currency like in EURUSD, we need RSI for USDEUR similarly we need RSI for USDGBP, USDNZD and USDAUD. We can find the RSI for USDEUR from that of EURUSD by subtracting it from 100. Watch this video tutorial on how to trade with Pivot Points.
Why we will use RSI? RSI is a momentum indicator that measure momentum over the past n periods. It can be 14 period which is the default setting. It can be 7 periods. We will use 7 periods.
As a day trader you are daily faced with the challenge of deciding which currency pair to trade. You cannot look at all the 28 currency pair charts. Even if you monitor all the 28 currency pairs you will just not get the desired results. Some pairs will be ranging. Rather many pairs will be ranging and trading them will only give you 20-30 pips.
from datetime import datetime
from MetaTrader5 import *
#from pytz import timezone
import matplotlib.pyplot as plt
#utc_tz = timezone('UTC')

# connect to MetaTrader 5
MT5Initialize()
# wait till MetaTrader 5 establishes connection to the
# trade server and synchronizes the environment
MT5WaitForTerminal()

# request connection status and parameters
print(MT5TerminalInfo())
# get data on MetaTrader 5 version
print(MT5Version())

import pandas as pd
import time
#pd.set_option('display.max_columns', 500)
# number of columns to be displayed
#pd.set_option('display.width', 1500)
# max table width to display

#import ta
import talib


currency_pair =["EURUSD","EURGBP","EURJPY","EURAUD","EURNZD",
"EURCHF","EURCAD","GBPUSD", "GBPJPY","GBPAUD","GBPNZD","GBPCAD",
"GBPCHF","USDCAD", "USDJPY","CHFJPY","CADJPY","NZDJPY","AUDJPY",
"AUDNZD","AUDCAD", "NZDUSD","NZDCAD","NZDCHF","AUDCHF","CADCHF",
"AUDUSD","USDCHF"]
'''
time_frame=[MT5_TIMEFRAME_M1, MT5_TIMEFRAME_M2,MT5_TIMEFRAME_M3,
MT5_TIMEFRAME_M4, MT5_TIMEFRAME_M5, MT5_TIMEFRAME_M6,MT5_TIMEFRAME_M10,
MT5_TIMEFRAME_M12,MT5_TIMEFRAME_M15, MT5_TIMEFRAME_M20,MT5_TIMEFRAME_M30,
MT5_TIMEFRAME_H1,MT5_TIMEFRAME_H2, MT5_TIMEFRAME_H3,MT5_TIMEFRAME_H4,
MT5_TIMEFRAME_H6,MT5_TIMEFRAME_H8, MT5_TIMEFRAME_H12,MT5_TIMEFRAME_D1,
MT5_TIMEFRAME_W1, MT5_TIMEFRAME_MON1]

time_frame=["M1", "M2", "M3", "M4", "M5", "M6", "M10", "M12",
"M15", "M20", "M30","H1", "H2", "H3", "H4", "H6", "H8", "H12",
"D1", "W1", "MON1"]
'''
# set time zone to UTC
#timezone = pytz.timezone("Etc/UTC")
#now = datetime.now()
# create 'datetime' object in UTC time zone
# to avoid the implementation of a local time zone offset
#utc_from = datetime(2019, 4, 5, tzinfo=timezone)

lookback=50
# create DataFrame out of the obtained data
currency_strength = pd.DataFrame()
rsi_df=pd.DataFrame()

period=MT5_TIMEFRAME_H8
period=MT5_TIMEFRAME_H12
start=time.time()
for pair in currency_pair:
    ohlc = MT5CopyRatesFrom(pair, period, datetime.now(), lookback)
    df = pd.DataFrame(list(ohlc),columns=['Time',
    'Open', 'Low', 'High', 'Close', 'tickVolume',
    'Spread', 'realVolume'])
    rsi_df[pair]=talib.RSI(df.Close,7)

rsi_df.tail()
strength=pd.DataFrame()
strength["USD"]=1/7*((100-rsi_df.EURUSD)+(100-rsi_df.GBPUSD)+\
    rsi_df.USDCAD+rsi_df.USDJPY+(100-rsi_df.NZDUSD)+\
        (100-rsi_df.AUDUSD)+rsi_df.USDCHF)
strength["EUR"]=1/7*(rsi_df.EURUSD+rsi_df.EURGBP+\
    rsi_df.EURJPY+rsi_df.EURAUD+rsi_df.EURNZD+rsi_df.EURCHF+\
        rsi_df.EURCAD)
strength["GBP"]=1/7*(rsi_df.GBPUSD+rsi_df.GBPJPY+\
    rsi_df.GBPAUD+rsi_df.GBPNZD+rsi_df.GBPCAD+rsi_df.GBPCHF+\
        (100-rsi_df.EURGBP))
strength["CHF"]=1/7*((100-rsi_df.EURCHF)+(100-rsi_df.GBPCHF)+\
    (100-rsi_df.NZDCHF)+(100-rsi_df.AUDCHF)+(100-rsi_df.CADCHF)+\
        rsi_df.CHFJPY+(100-rsi_df.USDCHF))
strength["JPY"]=1/7*((100-rsi_df.EURJPY)+(100-rsi_df.GBPJPY)+\
    (100-rsi_df.USDJPY)+(100-rsi_df.CHFJPY)+(100-rsi_df.CADJPY)+\
        (100-rsi_df.NZDJPY)+(100-rsi_df.AUDJPY))
strength["AUD"]=1/7*((100-rsi_df.EURAUD)+(100-rsi_df.GBPAUD)+\
    (100-rsi_df.AUDJPY)+rsi_df.AUDNZD+rsi_df.AUDCAD+
    rsi_df.AUDCHF+rsi_df.AUDUSD)
strength["CAD"]=1/7*((100-rsi_df.EURCAD)+(100-rsi_df.GBPCAD)+\
    (100-rsi_df.USDCAD)+rsi_df.CADJPY+(100-rsi_df.AUDCAD)+\
        (100-rsi_df.NZDCAD)+rsi_df.CADCHF)
strength["NZD"]=1/7*((100-rsi_df.EURNZD)+(100-rsi_df.GBPNZD)+\
    rsi_df.NZDJPY+rsi_df.NZDUSD+rsi_df.NZDCAD+rsi_df.NZDCHF+\
        (100-rsi_df.AUDNZD))

strength.tail()
strength.iloc[-2]
strength.iloc[-11]
end=time.time()
time_taken=end-start
print(time_taken/60)

plt.plot(strength.USD, label="USD")
plt.plot(strength.EUR, label="EUR")
plt.plot(strength.GBP, label="GBP")
plt.plot(strength.JPY, label="JPY")
plt.plot(strength.CAD, label="CAD")
plt.plot(strength.NZD, label="NZD")
plt.plot(strength.AUD, label="AUD")
plt.plot(strength.CHF, label="CHF")
plt.text(len(strength),strength.USD.iloc[-1], "USD")
plt.text(len(strength),strength.EUR.iloc[-1], "EUR")
plt.text(len(strength),strength.GBP.iloc[-1], "GBP")
plt.text(len(strength),strength.JPY.iloc[-1], "JPY")
plt.text(len(strength),strength.CAD.iloc[-1], "CAD")
plt.text(len(strength),strength.NZD.iloc[-1], "NZD")
plt.text(len(strength),strength.AUD.iloc[-1], "AUD")
plt.text(len(strength),strength.CHF.iloc[-1], "CHF")
plt.legend(loc="upper left")
plt.show()

#currency = ["USD","EUR","GBP","CHF","JPY","AUD","CAD","NZD"]


# shut down connection to MetaTrader 5
MT5Shutdown()
# request connection status and parameters
print(MT5TerminalInfo())

#function to plot strength
def plot_strength(strength):
    for x in currency:
        plt.plot(strength[x], label=x)
        plt.text(len(strength),strength[x].iloc[-1], x)
    plt.legend(loc="upper left")
    plt.show()

plot_strength(strength)


matching=[x for x in currency_pair if 'USD' in x]

def normalized_strength(strength):
    normalized_strength=pd.DataFrame()
    for z in currency:
        matching=[x for x in currency_pair if z in x]
        for x in matching:
            #normalized_strength[x]=strength[x[0:3]]-strength[x[3:6]]
            normalized_strength[x]=strength[x[0:3]]/strength[x[3:6]]
            normalized_strength[x]-=normalized_strength[x].mean()
            normalized_strength[x]/=normalized_strength[x].std()
    return normalized_strength

df=normalized_strength(strength)
Above is the python code. I first developed the currency strength indicator in MQL4 for MT4. I tested it on H4. Then I thought I should develop it in MQL5 for MT5 as we have more timeframes available on MT5 like H2, H6, H8 and H12. So I tried but got stuck. MQL5 has severe limitations when it comes to developing multi timeframe and multi instrument indicators. I don’t know from where they got the idea of an indicator handle. I also work on NinjaTrader and develop indicators for it using C# based NinjaScript Framework. NinjaScript is a very powerful framework developed in C#. MQL5 is nothing in front of it.
Python is a very powerful programming language that we can use for prototyping. Python is the language when it comes to machine learning and artificial intelligence. So I opened up Visual Studio Code and code the whole Currency Strength script in Python. I have pasted the python code above. I have few more ideas that I will discuss in this post. Those ideas are based on pairs trading strategy that is very popular in algorithmic stock trading. We will see if we can apply the pairs trading strategy here as well. So keep on reading.
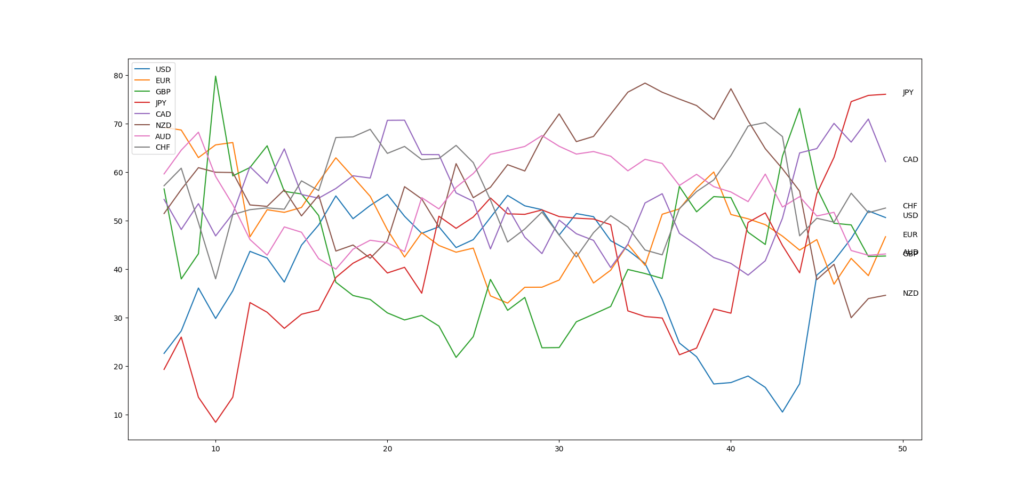
Above is the Currency Strength plot of H12 timeframe. You will find currency strength indicators being sold online for $100-$150. The important question? Are these currency strength indicators really good at predicting the currency pair movement? Let’s explore that in this post and let’s us also try to make a really workable currency strength indicator using the power of python. Did you notice one thing? MT5 now supports python. You can easily download all the data you want from MT5 directly in your python code.
def download_data(dict1, currency_pair, period, lookback):
# connect to MetaTrader 5
MT5Initialize()
# wait till MetaTrader 5 establishes connection to the
# trade server and synchronizes the environment
MT5WaitForTerminal()
# request connection status and parameters
print(MT5TerminalInfo())
# get data on MetaTrader 5 version
print(MT5Version())
#download each currency pair data
for pair in currency_pair:
ohlc = MT5CopyRatesFrom(pair,period,datetime.now(),lookback)
df = pd.DataFrame(list(ohlc),columns=['Time',
'Open', 'High', 'Low', 'Close', 'tickVolume',
'Spread', 'realVolume'])
dict1[pair]=df
# shut down connection to MetaTrader 5
MT5Shutdown()
# request connection status and parameters
print(MT5TerminalInfo())
return dict1
download_data(dict1,currency_pair,period,lookback)
import pickle
f = open('D:/Shared/MarketData/cs1.csv','wb')
pickle.dump(dict1,f)
f.close()
infile = open('D:/Shared/MarketData/cs1.csv','rb')
dict1 = pickle.load(infile)
infile.close()
dict1['EURGBP'].tail()
#function to plot strength
def plot_strength(strength):
for x in currency:
plt.plot(strength[x], label=x)
plt.text(len(strength),strength[x].iloc[-1], x)
plt.legend(loc="upper left")
plt.show()
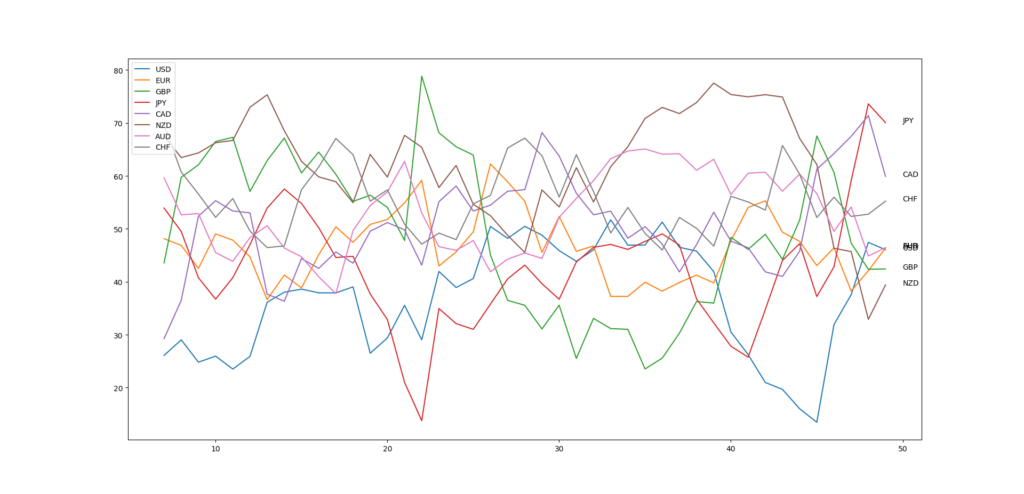
plot_strength(strength[120:150])
matching=[x for x in currency_pair if 'USD' in x]
def normalized_strength(strength):
normalized_strength=pd.DataFrame()
for z in currency:
matching=[x for x in currency_pair if z in x]
for x in matching:
#normalized_strength[x]=strength[x[0:3]]-strength[x[3:6]]
normalized_strength[x]=strength[x[0:3]]/strength[x[3:6]]
normalized_strength[x]-=normalized_strength[x].mean()
normalized_strength[x]/=normalized_strength[x].std()
return normalized_strength
def normalized_strength1(strength):
normalized_strength=pd.DataFrame()
for z in currency:
matching=[x for x in currency_pair if z in x]
for x in matching:
normalized_strength[x]=strength[x[0:3]]-strength[x[3:6]]
#normalized_strength[x]=strength[x[0:3]]/strength[x[3:6]]
normalized_strength[x]-=normalized_strength[x].mean()
normalized_strength[x]/=normalized_strength[x].std()
return normalized_strength
df=normalized_strength1(strength)
fig, axis = plt.subplots(3)
axis[0].plot(strength.USD, label='USD')
axis[0].title.set_text('USD Strength')
axis[1].plot(strength.GBP, label='GBP')
axis[1].title.set_text('GBP Strength')
axis[2].plot(dict1['GBPUSD'].Close, label='GBPUSD')
plt.legend(loc="upper left")
plt.show()
I have written the above function that downloads 28 currency pairs data and saves it in a dictionary. It takes less than a few seconds. Anytime I want to save the data, I can use pickle and save the dictionary on my hard drive in the folder of my choice.
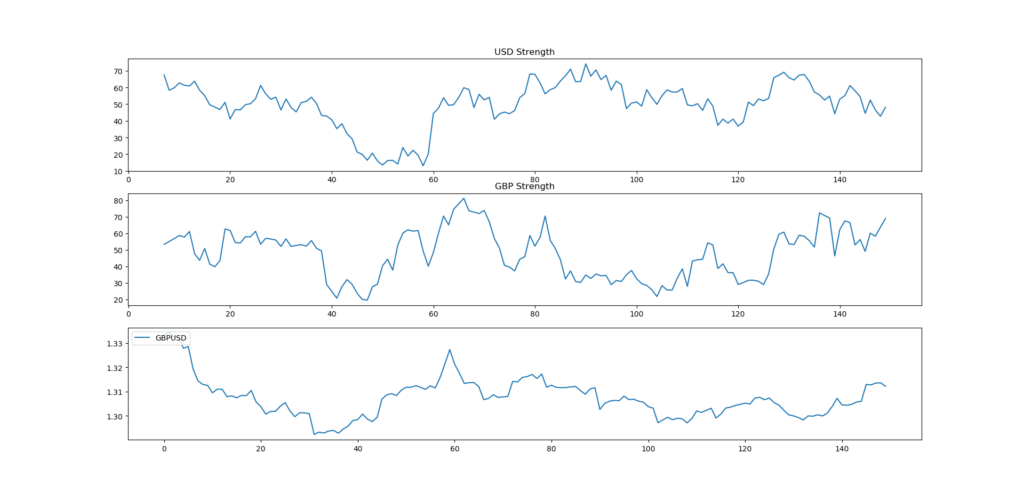
Above is the image of GBPUSD price and GBP currency strength and USD currency strength. You can see when GBPUSD price is lowest, GBP strength is lowest around 20 and JPY strength is around 60. Below is another image. This time of USDJPY.
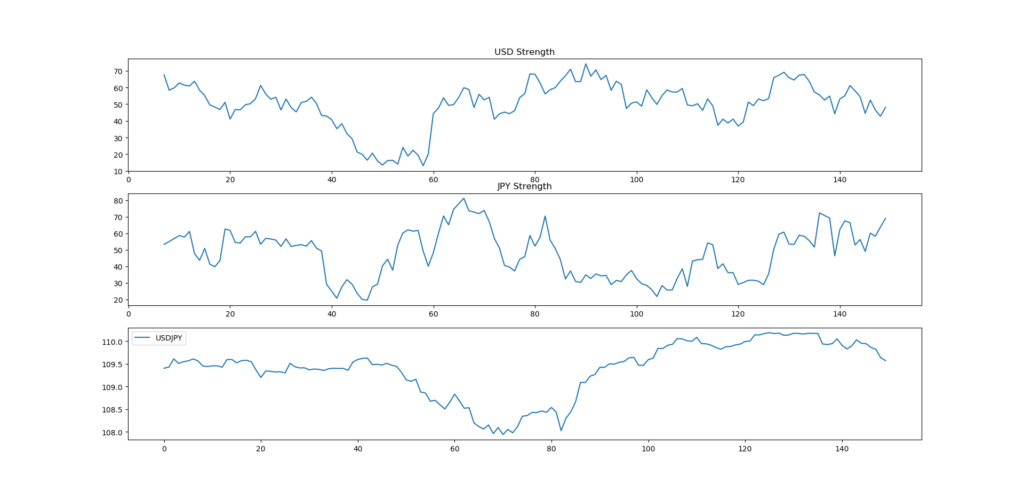
Above is USJPY H4 price data with USD currency strength and JPY currency strength. The screenshot of GBPUSD I am posting again with the price data now reduced to make the picture more clear so that we can see what is happening.
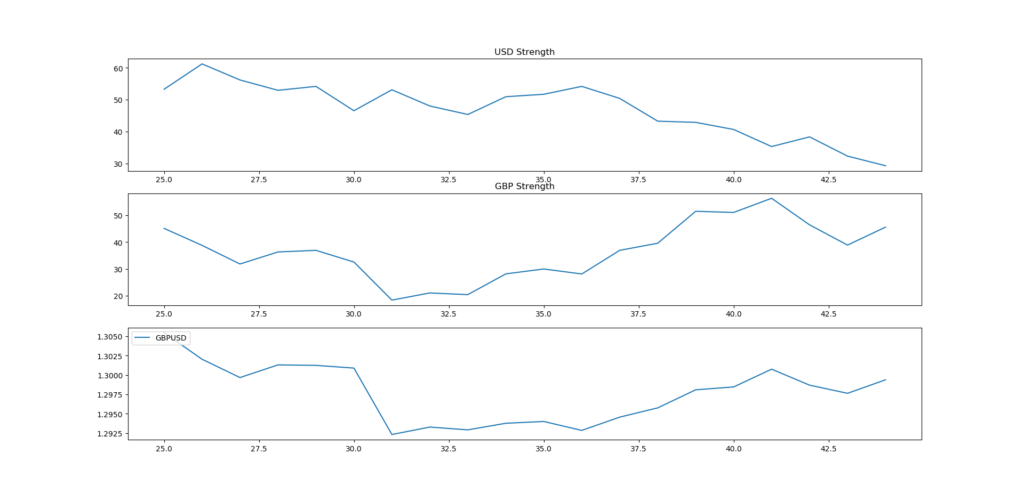
As you can see when the price is making the lowest low, GBP strength is also making the lowest low and USD strength is above 50 but below 60. GBP strength hovering around 20 is an indication that GBPUSD might have reached its low. But we are not sure. Currency strength does not help us find the exact low. What we need is a model that we can use to build an indicator around currency strength and use it in actual trading. Can we do that? We will see that in this post. So keep on reading.
Can we use machine learning? You will be surprised to know that some of the best and most profitable trading systems have used linear models. So this is what we are going to do. We will try to fit a linear model and see if we can use it to predict price from individual currency strengths. Linear models are easy to fit and take a lot of less time than the neural networks and the deep learning models that have become so much popular now a days. If a linear model works and makes pips for us why use a non linear model that takes time and is difficult to fit. This is what I plan to do. First fit autoregression and check if we have good prediction and then fit lasso and ridge regression models and see if they work.